| Home | Search | FPC | Contact Us |
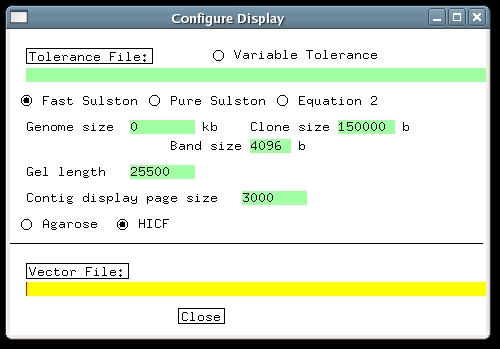
| 1. HICF Data HICF fingerprint data consists of fragment sizes and color labels. Each fragment has a color, and the fragments initially are sized in basepairs, with one significant decimal place. Typically only the fragments from 50-500bp in size are used, because fragments outside this range are unreliable. FPC does not accept color labels or fractional sizes, so the fragments must be manipulated before being loaded into FPC. First, every size is multiplied by a number, typically 10 or 20, after which the decimal part can be dropped without losing significant information. This results in a set of fragments in some range, e.g. 500-5000 for factor 10 and the 50-500bp range given above. Then the color labels are converted to non-overlapping numeric ranges by adding a different offset value for each color. For example, with the numbers above one could add 15,000 to red fragments, 10,000 to yellow, 5,000 to green, and 0 to blue. This puts each color into its own range, not overlapping with fragments of other colors. The total range is then 0-20,000, with 4 gaps of length 500. Note that number of colors, the range of sizes used, the multiplication factor and the color shifts, can all vary between different HICF projects. The only absolute requirement is that the colors be translated into numeric ranges which do not overlap. These numbers go into a bands file (or sizes file), which goes into the Image subdirectory, as described in the Manual. 2. Creating an HICF ProjectCreating an HICF project is the same as for agarose, except that the Gel length parameter has to be set differently, as will be described below. Now change to the demo/hicf directory. Type 'ls' and note that there is nothing there besides the band file demo.bands. Next type mkdir Image mv demo.bands Imageto set up the Image directory with the band file in it. Launch FPC by typing 'fpc', and on the main window right-click on 'File...', choosing 'Create new project'. Name the project 'demo'. On the main window, click 'Update .cor', to read in the bands from the Image directory. After reading in the bands, FPC will create a Bands directory, and put the bands file in it, where it will not be used again. If the bands file had extension '.sizes' instead of '.bands', it would be transferred to a 'Sizes' directory. Either suffix can be used. Now we must enter the gel length setting. Click the 'Configure' button on the FPC main window, and the 'Configure Display' window appears, with Gel length set to its default value of 3300. Gel length tells FPC the total number of values that the bands can have. It will depend on the number of colors and the range of sizes used for each color. This demo comes from a 3-color HICF project, in which fragments of size 75-500 were used. The multiplication factor was 20 and the colors were shifted by 20,000 for yellow, 10,000 for green, and 0 for blue. Therefore the total range of band values is (500-75)x20x3 = 25500. Enter this number into the Gel length text entry. As of the Feb 2006 FPC release, there is a new option on this menu, where you can select Agarose or HICF; select HICF. Close the Configure window. Click 'Save .fpc' on the main window, to ensure that the gel length setting is saved. The HICF radio button may also be checked although this currently affects only the MTP (minimal tiling path module).
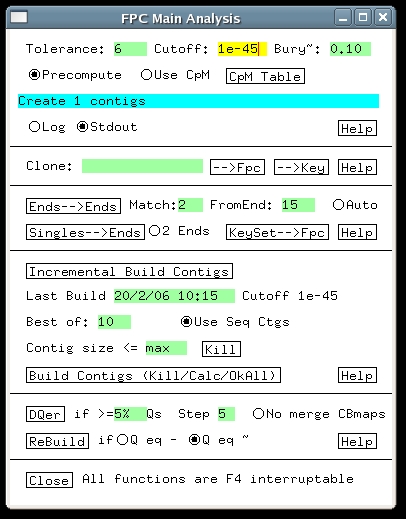
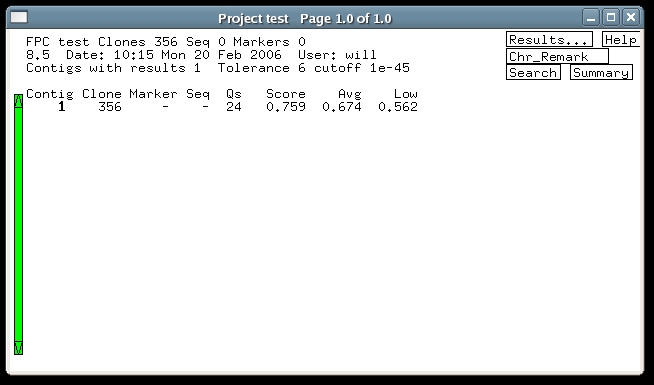
3. Building the HICF ProjectBefore building any project, it is strongly recommended to remove well-to-well contamination to the extent possible. FPC has a built-in contamination screen to assist with this. Building an HICF project is the same as for agarose, except that the tolerance and cutoff need to be adjusted. Click 'Main Analysis' on the FPC main window, and the Main Analysis window appears (some of the settings shown differ from what you initially see). The tolerance setting tells FPC how close two bands have to be to be considered matching. To determine its setting one has to measure how much difference there is in the output band sizes between different fingerprints of the same fragments. Usually vector bands are used to measure this, and for HICF the standard deviation of their sizes generally is about .15bp. Therefore a reasonable setting for tolerance is around .3 bp, but the build will work approximately the same over a range of tolerances. The reason for this is that with a smaller tolerance, fewer matches are found, but each match counts more strongly in the overlap score. Since we multiplied the fragment sizes by a factor of 20, the tolerance has to be multiplied by the same factor, giving a final value of .3x20 = 6. Enter this value into the Tolerance text entry. Next we must adjust the cutoff. In this case there is no fixed rule, but generally speaking HICF projects use smaller cutoffs than agarose. As described in the Automerge section of this tutorial, it may be best to choose quite a stringent cutoff initially, and then continue with merges at less stringent cutoffs. For the demo, enter 1e-45 into the Cutoff window, and press the button labeled 'Build Contigs (Kill/Calc/OkAll)'. This causes FPC to build all contigs from scratch, and after a few seconds, the project window appears showing the result as below. In this case, all the clones have gone into one contig.
4. Q Clones and HICFThe main thing to notice about the contig created above is that it has a significant number of Q clones.As described in the FPC Tutorial, the DQer is normally run after a build to try to break up contigs having excessive Qs. The assumption behind this is that Q clones signal false joins, and for agarose projects this has been a reasonable assumption. Unfortunately, HICF projects so far have exhibited another source of Q clones, namely errors in the band files. These errors consist of both spurious bands and missing bands, and they result in a certain unavoidable percentage of Q clones. Therefore, for HICF projects the DQer should be set using a percentage threshold, instead of a fixed number of Q clones. This is accomplished simply by entering a percentage, e.g., '5%' into the DQer 'if >= ' text window, as shown in the previous image of the Main Analysis window. The DQer step value needs to be raised from its default of 1, up to 3 or 5. A change of 1 in the cutoff exponent is not large enough to make a difference in HICF. After entering 10% and a step size of 5, run the DQer and you will see that the clones remain in the same contig, but the number of Qs has reduced to 14 (the reason for this is that it was assembled at a stricter cutoff, which still resulted in one contig but a better ordering). Note that usually we have found a 10% Q threshold to be appropriate for HICF, rather than the 5% of this demo. Another Main Analysis setting which can help handle noisy fingerprints is the "Best of:" setting, which controls how many different attempts FPC makes when building the consensus band maps. With more tries, FPC can frequently find a CB map with fewer Q clones. This takes more time, but for HICF projects it is recommended. In general, the contigs are first built with tries=30, the DQer is run, and then the auto merge. |